The efficiency of the IT environment of an enterprise is a critical indicator of the quality of internal services provided within the organization. Internal services are used by employees where reliability and responsiveness influence better productivity and reduced stress.
Monitoring IT performance reduces the burden on IT resources as fewer performance-related service requests come to the IT desk. External services are more critical as they serve the customer base. Service disruptions caused by system outages slow down response time, thereby, creating a negative impact on customers.
Performance analytics is a metric that gauges an organization’s performance indicators, such as ROI and other KPIs, to understand reasons for increase/decrease enabling measures to improve and maximize performance. By analyzing key performance metrics, decision-makers can make informed decisions on areas of concern.
According to Allied Market Research, the global performance analytics market was valued at $1,568.49 million in 2018. It is expected to reach $6,506.11 million by 2026, recording a CAGR of 19.6% from 2019 to 2026.

ServiceNow Performance Analytics
Most enterprises are looking to create a goal-oriented working culture by empowering stakeholders with an easy-to-use, integrated app for analyzing, reporting, and visualizing business performance. Equipped with over 600 predefined KPIs to analyze and measure, the ServiceNow Performance Analytics (PA) includes interactive dashboards and advanced drill-downs to help extract meaningful insights from business data. It drives business transformation by empowering businesses to set, track, and match progress against pre-determined policies.
Resources can connect with quality data in less time, and this helps them focus on essential functions. Performance Analytics presents historical data in the form of graphs represented over a period enabling businesses to view and understand trends for a particular set of data. It also forecasts trends based on existing data and allows stakeholders to fix a target that can be achieved.
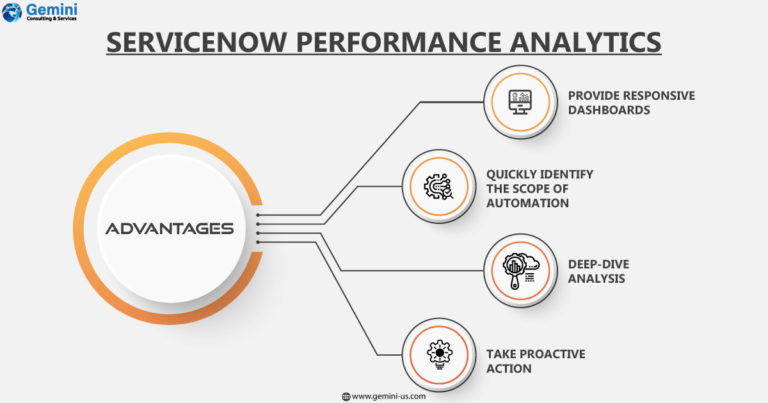
In short, ServiceNow Performance Analytics can:
- Provide responsive dashboards with historical and current data that can predict future market trends as well as identify new business opportunities.
- Help quickly identify the scope of automation and self-service in existing processes thereby aiding in enhanced efficiency, improved quality, and reduced costs.
- Analytical reports deep-dive into internal processes and identify top business priorities. This helps executives and stakeholders align decisions to allocate resources and efforts accordingly.
Focus on progress and take proactive action on KPIs using Analytics Hub, time charts, forecasts, and dashboards.
How Does It Differ from ServiceNow’s Basic Reporting?
The Basic reporting feature helps understand what happens in real-time within service management such as finding out the status of service tickets the team is working on currently. ServiceNow reporting provides a clear snapshot of what is occurring now but does not answer questions in a detailed manner nor does it help with trends. On the other hand, Performance Analytics provides archival context that can straightaway speak to the overall wellness of a business.
Without historical context, it can be a challenge to monitor and measure the realistic health of a business, and looking at daily reports can only give a shallow perspective. Consider understanding the impact a new hardware upgrade has on an incident resolution cost, PA can help stakeholders understand ticket distribution over time. It is also possible to predict the capability of business processes on the journey to success. ServiceNow PA can also help predict KPIs like open incidents and help see the position as on date as well as where it is headed in the future.
Uses of ServiceNow Performance Analytics
One potential area could include IT service management or ITSM to understand say, IT helpdesk tickets where KPIs for incident management. Details on new tickets, the average age of tickets, incidents resolved without escalating, reassignment, and accessing customer feedback on service quality can be obtained. Similarly, it can be applied to IT operations management or ITOM to monitor server capacity -whether they are near full capacity, due for upgrades, or if notifications reach when infrastructure goes offline to help the IT team. Implementation of Performance Analytics can help track uptime, server errors, lost data packets, authentication errors, IT policy breaches, and conformance to operational service level agreements (SLA).
The nature and scale of the IT operations and teams differ across organizations demanding a custom approach to implementing ServiceNow Performance Analytics. Partner with Gemini Consulting & Services for optimal utilization of the performance analytics feature of ServiceNow. Contact us to understand more about the role of ServiceNow Performance Analytics in your business.
The ServiceNow Performance Analytics module enables businesses to monitor and track server and digital service performance metrics for the long term. Enterprises can identify trends in the use of services and gain the ability to scale resources during peak hours, leading to greater resilience and service availability.
Understanding Key Performance Indicators
Accurate data is key for business analytics: the higher the quantity and quality of the data, the better outcome. ServiceNow Performance Analytics offers native monitoring of key performance indicators (KPIs), that can be coupled with ServiceNow modules and third-party software tools. This is loaded and displayed using a visualized dashboard that helps stakeholders understand resource utilization and other IT performance KPIs in a single go.
The result is a projection of the current performance on the network, that is accessible in any location or device with interactive dashboards. Key Performance Indicators (KPIs) help measure performance using historical data, and best-practice dashboard templates help monitor performance against KPIs with minimal setup. Enterprises can access these templates through the Performance Analytics Solutions Library. This helps improve the efficiency of monitoring and analytics tools on ServiceNow.
Data Screening in Real-Time
Real-time data streaming is the next step for performance analytics as networks evolve and bandwidths climb globally. Sharing system logs and user activity data in real-time can help resources visualize the real-time performance level of the IT environment. Responses can thus be proactive improving availability and the average time needed to resolve incidents.
Let us assume that the payment gateway of a given business experiences an outage preventing customers from making website purchases. Enterprises can then use real-time analytics through ServiceNow to monitor all the servers used to host the business website and payment gateway. It can highlight any network dependencies throwing errors. This mapping provides a clear pathway to IT teams who can resolve it right away.